
Matrix Profile for Detecting Anomalies or Patterns in Time Series
February 19, 2025
Lorenzo Palaia
Software Engineer
Overview
Recently, I came across several posts explaining the Matrix Profile concept, and it immediately caught my attention. Being fascinated by time series analysis, particularly having experimented with AI models for stock market prediction and similar applications, I decided to dive deeper into this topic and share my findings here. 🎯
Detecting patterns and anomalies in time series data is a fundamental problem in many fields, from finance to healthcare and IoT. Traditional methods often struggle with scalability, interpretability, or robustness. The Matrix Profile is a powerful, efficient technique that overcomes these challenges, enabling fast and accurate pattern discovery. 📈✨
This post explores the core concepts behind the Matrix Profile, its applications, and how it can be used to enhance anomaly detection and motif discovery in time series analysis. Let's dive in! 🚀
Introduction
Time series data can be challenging to analyze due to its complex and often noisy nature. Traditional approaches, such as moving averages or statistical models, can fall short in detecting subtle patterns or rare anomalies. The Matrix Profile, introduced by researchers at the University of California, Riverside, provides an elegant and computationally efficient solution. 🧠📊
The goal? Automatically identifying recurring patterns (motifs) and anomalies (discords) in time series data with minimal parameter tuning. Let's dive into how it works! 🎯
What is the Matrix Profile?
At its core, the Matrix Profile is a vector that stores the Euclidean distance between each subsequence of a time series and its nearest neighbor. This enables:
- Motif discovery: Finding frequently occurring patterns.
- Anomaly detection: Identifying unusual sequences that deviate from expected behavior.
- Time series segmentation: Detecting change points in data streams.
The key advantage? Computational efficiency. Algorithms like STOMP and SCRIMP++ allow near real-time analysis even on large datasets. ⏱️💡
Computational Complexity
While the Matrix Profile calculation might seem straightforward at first, it presents significant challenges when working with long time series. Let's examine the complexity:
Naive Approach (Brute Force)
python
This approach has:
- Computational complexity:
- Spatial complexity:
For a time series from a sensor collecting data 20 times per minute for 5 years:
python
This would require about 4.4 years of computation and 11.1 PB of memory! 😱
Efficient Solution: STOMP
The STOMP (Scalable Time series Ordered-search Matrix Profile) algorithm reduces computational complexity to , making the calculation feasible:
python
Exclusion Zone
An important detail is the "exclusion zone" that prevents trivial matches:
python
The default size is , where is the window size. 🎯
Anomaly Detection
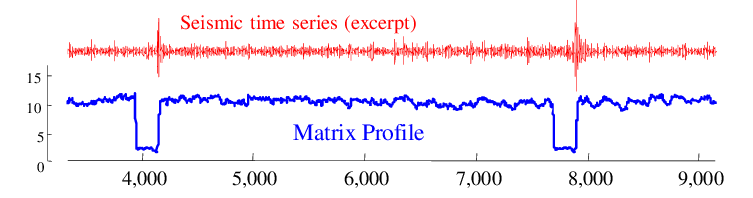
Anomalies, or discords, are time series segments that differ significantly from all others. The Matrix Profile simplifies anomaly detection by ranking subsequences based on their similarity scores. High-distance values indicate outliers, making it easy to flag unusual behavior.
Example Use Cases:
- Financial fraud detection 🏦
- IoT sensor fault detection 🏭
- Healthcare anomaly monitoring 🏥
By leveraging the Matrix Profile, you can quickly identify and investigate anomalies in your time series data. 🚨
Pattern Discovery
Finding repeated patterns, or motifs, is crucial in understanding underlying trends. The Matrix Profile identifies motifs efficiently by ranking subsequences with the smallest distances. This helps in:
- Stock market trend analysis 📊
- Human activity recognition 🏃
- Cybersecurity threat detection 🔐
By uncovering recurring patterns, you can gain valuable insights into your time series data and make informed decisions. 📈
Real-World Applications
1. Finance & Trading
Identifying repetitive patterns in stock market data can help detect bullish or bearish signals. Traders use motif discovery to design algorithmic strategies. 💹
2. Healthcare & Biomedicine
From ECG monitoring to brainwave analysis, detecting anomalies in medical data can aid in early diagnosis. 🏥
3. Industrial IoT & Smart Manufacturing
IoT devices generate vast amounts of sensor data. The Matrix Profile helps detect mechanical failures before they cause damage. ⚙️
Implementing the Matrix Profile
You can start using the Matrix Profile in Python with the stumpy library:
python
This snippet computes the Matrix Profile for a random time series and identifies the most anomalous subsequence. 📌
Advanced Usage
Exclusion Zone Configuration
python
Distributed Computation
Despite optimizations, the computational complexity remains , which can be challenging for very long time series. To address this, STUMPY supports distributed computation with Dask:
python
This allows scaling the analysis across computer clusters! 🚀
Conclusion
The Matrix Profile stands out for its remarkable simplicity in configuration: with just the window size parameter to set, it eliminates the complexity of parameter tuning common in other time series analysis methods. This simplicity, combined with its computational efficiency, makes it a powerful tool for extracting insights from complex time series data across finance, healthcare, IoT, and beyond. 📈
Are you ready to integrate the Matrix Profile into your workflow? 🚀